Word up
How many words do you need for hip hop songs?
Quantitative Analysis on Hip Hop Lyrics
This project begins with curiosity about how many words I need to understand
hip hop lyrics. After this question, the question made me to deep dive into
examining linguistic patterns of hip hop lyrics.
Live Demo: https://jotnajoa.github.io/wordup/index.html
(Mobile device is not supported)
Project Description
Project Goal
Understanding Pattern
This project aims to find word use pattern in hip hop songs, for example hip hop adapts greater size of vocabulary over time or the size of vocabulary has become smaller.
Analysis of Diversity in Rap Lyrics
Another goal of this project is to measure the diversity of vocabulary across songs. Less the commonly used vocabulary, higher the diversity is. This project examines if the vocabulary diversity has been increased or decreased over time.
Data
Lyrics Data
Genius.com provides open source API which includes song titles, lyrics and related collaboration works with dates. Lyrics data was collected from Genius API.
Notable Artists
To examine overall trends, representative indicator has to be chosen. “Notable hip hop artists” were chosen from Wikipedia which tells general public’s opinion
Analysis Approach & Hypothesis
Vocabulary Count
If songs uses diverse vocabulary,
notwithstanding large word count, Vocabulary Count (excluding the repeated use of a same vocabulary) will be significantly smaller than word count.Vocabulary Diversity Analysis
In order to analyze vocabulary diversity across different era of rap songs, the project analyzes how much a certain percentage of the most frequently used words makes up for the total lyrical content (of the era).
Design Components
Ambient Set up
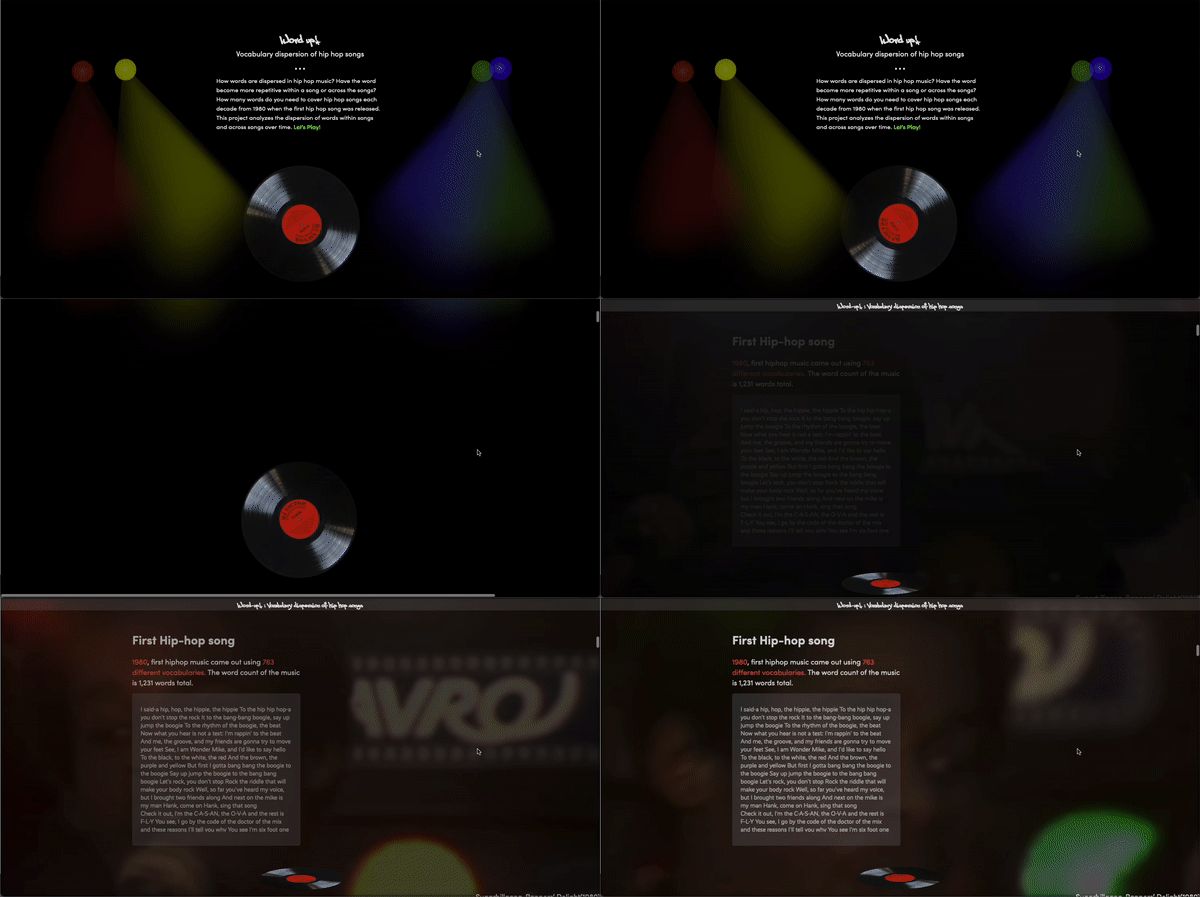
The project aims to create user experience as if the user enters a hip hop club and have a journey to see the trends of raps songs over time. The mood the project provides is casual and funky atmosphere. The color schemes and animations are tailored to generate the pop-culture-like theme.
Elements
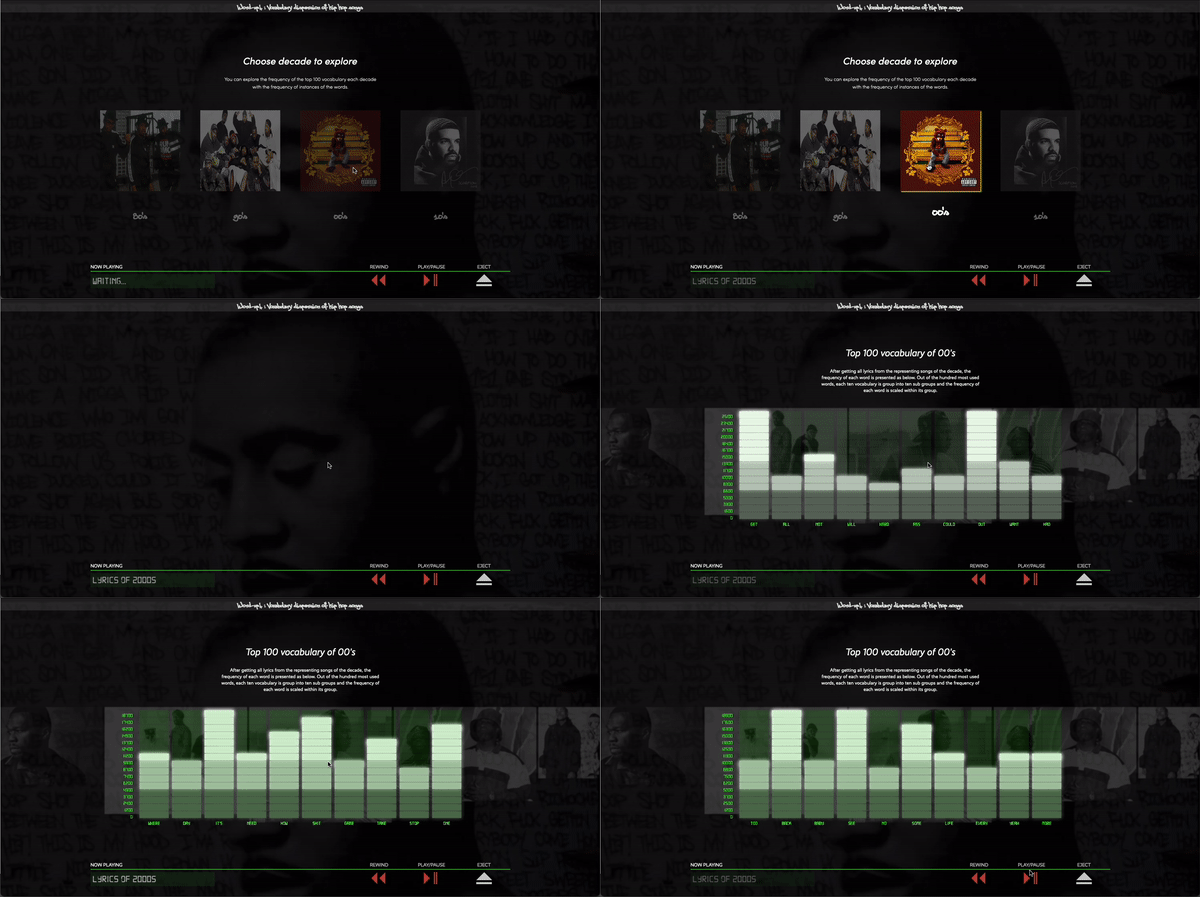
Visual elements used for the project are inspired by analogue music player interface. By the music player user interface, audience could feel ‘Throw Back’ feeling back to 90’s and 80’s looking back and forth of the timeline of the hip hop history.
Story Telling & Interaction
The visualization needs to provide user interactions so that the user can explore the data set by choosing different decades and compare the visual representation of the data.
Visualization Approach
Transition
In order to create a virtual experience that the user enters a club, luminosity transition is used at the beginning stage.
Highlight
Insight abstracted from huge data is highlighted by contrast to provide keen and brief take away
Data Processing
Data Collection
Complete lyrics data can only be parsed by unique ids in Genius API. Therefore, a series of looping was necessary. After getting the list of artists, I built a loop whichs send and receive data to create object array which contains all the information necessary.
Data Cleanup
The size of data was so large that it was not manageable from client side. Therefore, top 10 songs of each artist was chosen to make key indicators. Different data visualizations requires different form of data. And it was not efficient to transform the data on web. So the data was pre-processed by node.js
Reading Data
Considering loading time for each data, it is more efficient to load data when it is needed by each data visualization. so I set the event listeners based on scroll and loaded data in each stage.
Methodology
Data Selection
The notable artist list was scrapped from ‘wikipedia’
notable hip hop artists list.
Analyzing HTML Structure
Scrapping text elements
Tool used: Node.js + Puppeteer Library
Data Collecting
To get actual lyrics, genius API was used.
Getting artists’ unique id from the first API call
Each artist’s song ids from the second API call
Gathering all the lyrics from the first and second API
Tool Used: Node.js + Axios
Data visualization
Visualization is created by using the two technical approaches .
For the smaller data node rendering - svg rendering
For the gigantic data node rendering - canvas
Tool Used : d3.js + html canvas + gsap


