Travel Blog
-Mini project Series (3/3)-
(Meeting locator / IOT thermometer project / Personal blog project)
This project is a graphic journal about my travel during Thanks Giving holidays (2020).
For each place I visited, photo, climate and geographic data is visualized.
Live Demo: https://datastructuresoonk.herokuapp.com/blgpjt/(No longer available)
(Mobile device is not supported)
Project Statement
Background
As a last piece of mini project series, this project is based on free topics. After finishing the last piece of mini project, this project was published online in Heroku hosting service.
Goals
Connect activities with data
Daily episodes were saved in photos with temperature data obtained from Particle device.
Host project live online
Structure of website is built using Express.js and the hosting was done by Heroku. Not only this project, all of the three mini projects were published under one domain with the help of routing.
Process
Documentation of Trip
I chose photo documentation for each place along with temperature data.
The location data were automatically populated by iphone photo apps that I didn’t need to do extra steps to get the information.
Geo-code
Unlike the second project of this series, the location log is not based on street address. Instead, the photo log shows name of ‘neighborhood’ for example, ‘Mid Cambridge Boston’. Therefore, the list of places has to be sent to TOMTOM API and stored in postgresql.
Methodology
Mapping Travel
Based on the collected temperature data, simple interactive line chart was generated using d3 js.
The data is stored in postgresql and was called by
request call. For performance they are stored JSON.
Tools: d3.js, posgresql
Temperature Collection
Using AWS and Particle device connected, the automated process to collect temperature data is built. On a specific time everyday, particle device send the temperature data to AWS and stored it.
Tools: Particle, AWS
Publishing
To publish this web application with its router for audiences to navigate from this project to the other project, routing library was used.
Tools: node.js + express + heroku
Visualization
Interface sketch
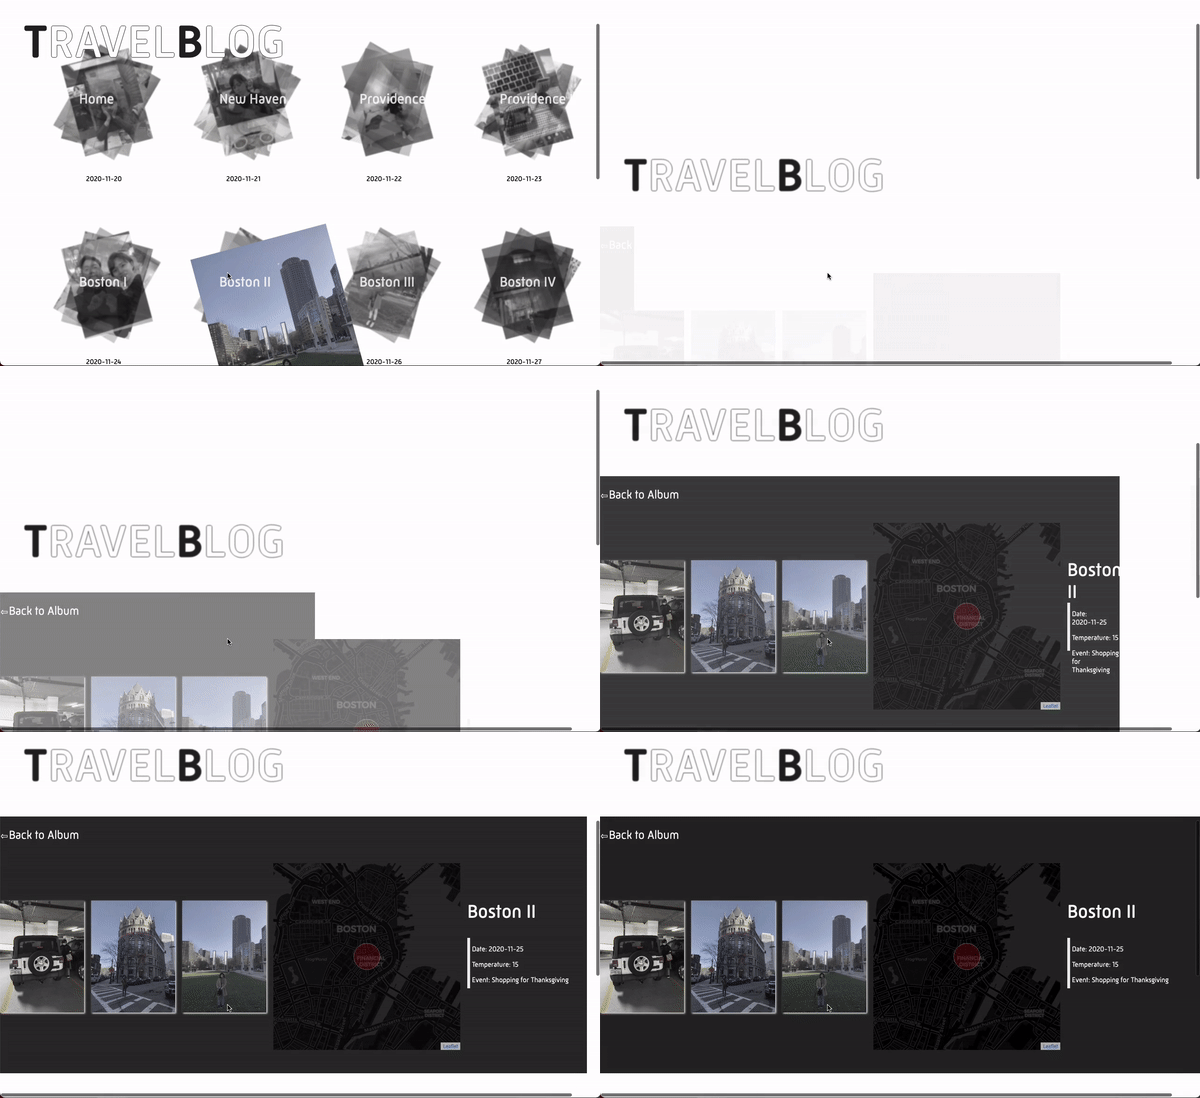
The visualization is composed of two elements. First interface is where
user selects the place to explore.Once the selection is made, corresponding
location is displayed with the photos taken in the place and location mapping
with basic information including temperature on that day.
Albums of places visited
The events in each location has been photo-documented. As an album spreads, each places visited is animated with timeline animation. User can select the place to explore.
Details of the Place
The episodes happened in the location is displayed with basic temperature informationwith location information. Instead of showing the entire temperature data, average temperature
is given briefly.


